IC Markets Home Sign in Web Trader Contact Us
IC Markets Social IC Markets Social

Information Hub for
Serious Traders

  • ABOUT US
  • OPEN LIVE ACCOUNT
  • OPEN DEMO ACCOUNT
  • TRADE NOW
  • VISIT OUR BLOG
IC Markets Social
  • ABOUT US
  • OPEN LIVE ACCOUNT
  • OPEN DEMO ACCOUNT
  • TRADE NOW
  • VISIT OUR BLOG
July 6, 2021Precious_Metals_esIC Markets

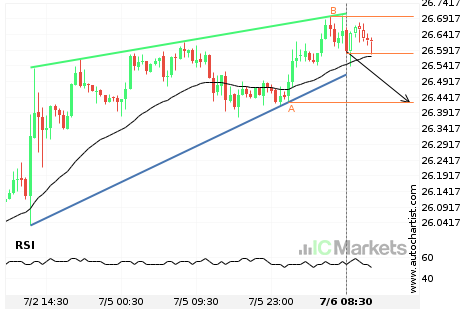
SILVER – acercándose a el soporte del Cuña ascendente

El SILVER avanza hacia la línea de soporte de un Cuña ascendente. Como le hemos visto retroceder desde esta línea ya antes, podríamos presenciar, o bien, una irrupción a través de esta línea o una recuperación a los niveles actuales. Ha llegado a esta línea en numerosas ocasiones en los últimos 4 días y puede […]

Read more
July 5, 2021Precious_Metals_esIC Markets

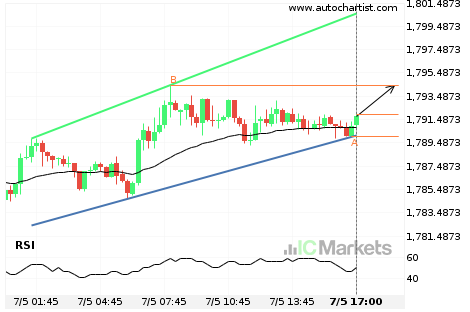
¿Tendrá el GOLD suficiente impulso como para irrumpir la resistencia?

El GOLD se dirige hacia la línea de resistencia de un Canal alcista y puede alcanzar este punto en las próximas 5 horas. Ha probado esta línea ya en numerosas ocasiones en el pasado, y esta vez no tendría porqué ser diferente y terminar con una recuperación en lugar de una irrupción. Si ésta última […]

Read more
July 5, 2021Precious_Metals_esIC Markets

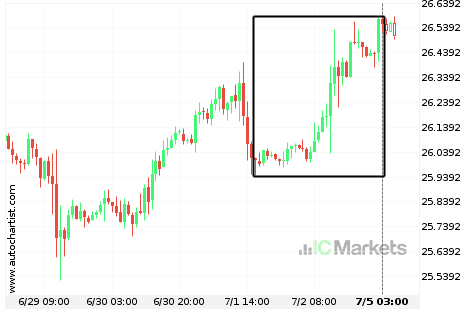
¿Hacia dónde se dirige el SILVER?

Un movimiento de un 2,1% en 4 días de SILVER no pasa desapercibido. Puede empezar a considerar hacía donde se dirigirá ahora: si seguirá con la tendencia ascendente actual o volverá a la dirección anterior.

Read more
July 4, 2021Precious_Metals_esIC Markets

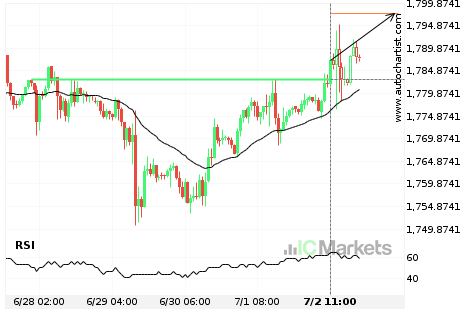
¿Deberíamos esperar una tendencia alcista en el GOLD?

La irrupción del GOLD a través de la línea de precio de 1782.9301 es la ruptura de un importante precio psicológico que se ha probado en numerosas ocasiones durante el pasado. Si esta irrupción persiste, esperamos que el precio del GOLD pruebe el nivel de 1797.5310 en las próximas 15 horas. Debemos ser siempre cautelosos […]

Read more
July 1, 2021Precious_Metals_esIC Markets

¿Se espera una tendencia alcista para el GOLD?

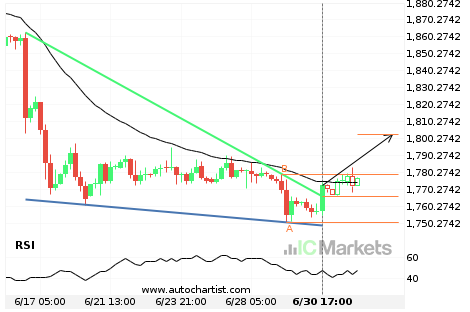
La irrupción del GOLD a través de la línea de resistencia de un Cuña descendente podría ser una señal de la ruta a seguir. Si esta irrupción persiste, esperamos que el precio del GOLD pruebe el nivel de 1802.3296 dentro de las próximas 2 días. Debemos siempre ser cautelosos antes de colocar una operación y […]

Read more
June 30, 2021Precious_Metals_esIC Markets

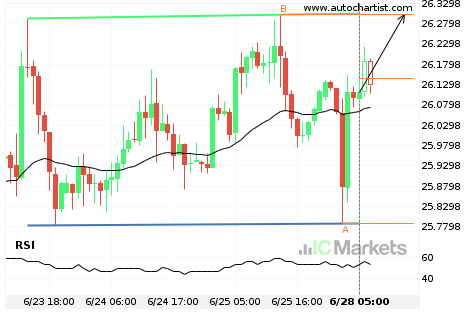
O bien, una inminente recuperación o una ruptura del SILVER

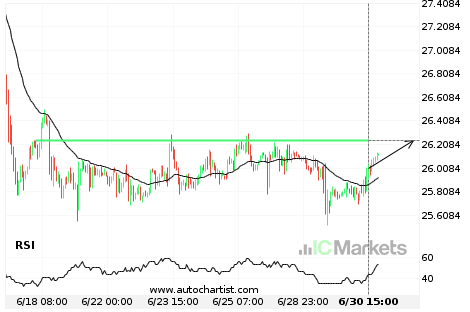
El SILVER avanza hacia la línea de 26.2450. Si este movimiento se mantiene, esperamos que el precio del SILVER pruebe el nivel de 26.2450 en las próximas 2 días. Pero no se apresure a la hora de operar, porque el par ha probado esta línea en numerosas ocasiones durante el pasado, por lo que este […]

Read more
June 30, 2021Precious_Metals_esIC Markets

¿Hacia dónde se dirige el GOLD?

Un movimiento de un 7,29% en 30 días de GOLD no pasa desapercibido. Puede empezar a considerar hacía donde se dirigirá ahora: si seguirá con la tendencia descendente actual o volverá a la dirección anterior.

Read more
June 29, 2021Precious_Metals_esIC Markets

El comienzo de una tendencia bajista para el GOLD

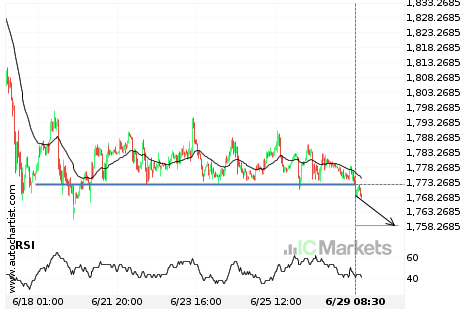
El GOLD ha atravesado una línea de 1772.4399. Si esta irrupción se mantiene, esperamos que el precio del GOLD pruebe el nivel de 1758.7640 en las próximas 2 días. Pero no debe apresurarse a la hora de operar, porque el par ha probado esta línea ya en numerosas ocasiones durante el pasado, por lo que […]

Read more
June 29, 2021Precious_Metals_esIC Markets

El SILVER se aproxima a el soporte de un Triángulo

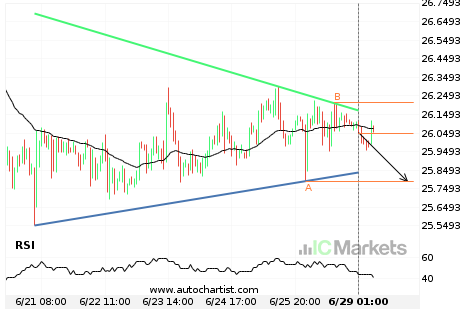
El SILVER se está acercando a la línea de soporte de un Triángulo. Ha llegado a esta línea en numerosas ocasiones durante los últimos 8 días. Si vuelve a probarla de nuevo, debería hacerlo en las próximas 2 días.

Read more
June 28, 2021Precious_Metals_esIC Markets

El SILVER se aproxima a la resistencia de un Rectángulo

El SILVER se está acercando a la línea de resistencia de un Rectángulo. Ha llegado a esta línea en numerosas ocasiones durante los últimos 5 días. Si vuelve a probarla de nuevo, debería hacerlo en las próximas 18 horas.

Read more
  • 1
  • 2
  • 3
  • …
  • 129
  • 130
  • 131
  • 132
  • 133
  • 134
  • 135
  • …
  • 146
  • 147
  • 148

Recent Posts

  • US Wall Street 30 Index – المستوى الرئيسي – مقاومة
  • Brent Oil vs US Dollar – نموذج الرسم البياني – قناة صاعدة
  • Brent Oil vs US Dollar – نموذج الرسم البياني – قناة صاعدة
  • Hong Kong 50 Index – نموذج الرسم البياني – مثلث صاعد
  • Hong Kong 50 Index – รูปแบบกราฟ – สามเหลี่ยมขาขึ้น

Recent Comments

    Translation


     Edit Translation

    Trade with

    a market leader you can rely on

    Open Trading Account Try a Free Demo

    Forex Trading

    • Accounts Overview
    • Open an Account
    • Launch Web Trader

    Trading Specifications

    • Spreads and Commissions
    • Range of Market
    • Trading Hours
    • Funding
    • Withdrawal

    About IC Markets

    • Help Center
    • Why IC Markets
    • Regulation
    • Legal Documents
    • Contact Us


    Forex Trading

    • Accounts Overview
    • Open an Account
    • Launch Web Trader

    Trading Specifications

    • Spreads and Commissions
    • Range of Market
    • Trading Hours
    • Funding
    • Withdrawal

    About IC Markets

    • Chat with a Specialist 24/7
    • Why IC Markets
    • Regulation
    • Legal Documents
    • Contact Us

    Disclaimer: This material is marketing material where all marketing material is published for informational purposes only. This material does not contain and should not be considered as containing - investment advice and recommendations, or suggestions for performing any actions with financial instruments. The built-in widgets belong to their external independent authors, and IC Markets is not responsible for their content and their impact on trade.

    All content rights reserved. Opinions of the authors may not coincide with the opinion of the blog editors. When copying materials from this site or connecting to an RSS feed to republish our articles, a link to IC Markets or attribution in the format ‘IC Markets Blog’ is required. For general questions, please contact the editorial office via the form on the Contact us page.

    Risk Warning: Trading Derivatives carries a high level of risk to your capital and you should only trade with money you can afford to lose. Trading Derivatives may not be suitable for all investors, so please ensure that you fully understand the risks involved and seek independent advice if necessary. A Product Disclosure Statement (PDS) should be considered before entering into a transaction with us.

    The contents of this page are general information only and does not take into account your personal situation, financial objectives or needs. It is up to you to make sure the products that we offer suit your specific needs. You should not trade with us unless you understand the features and risks of the products that we offer. This means that you might need to seek independent advice before you start trading with us.

    © 2022 Raw Trading Ltd | All rights reserved.
    • Sample Page